


Using College Football Conference Variance Scores To Pick Your Longshots
What is Variance Score and how can it be used to pick longshots in college football conferences? Let's explore.

The future of college football is becoming increasingly dichotomous. But in spite of the biggest brands realigning into just the Big Ten and SEC, hundreds of thousands still tune in Tuesday and Wednesday night to watch the MAC – oftentimes two sub-.500 teams that rank below 110th in power nationally.
Take, for example, last year’s contest between 3-6 Ball State and 5-4 Buffalo. On paper, there really wasn’t much to get excited about. But if you didn’t tune in, you missed a buck wild 51-48 overtime shootout that included 38 second-quarter points and 24 fourth-quarter points.
How does relatively low-level D-I college football manage to produce such a dependably entertaining product? Conference variance.
I’ve looked at conference variance the last two seasons to help pinpoint opportunities for longshots. Looking for a few of your own? Perhaps I can point you in the right direction.
Thanks for choosing to support human writers by reading this Substack. Consider subscribing for more and check back for college football previews and analysis leading up to the 2025 season.
College Football Conference Variance Score
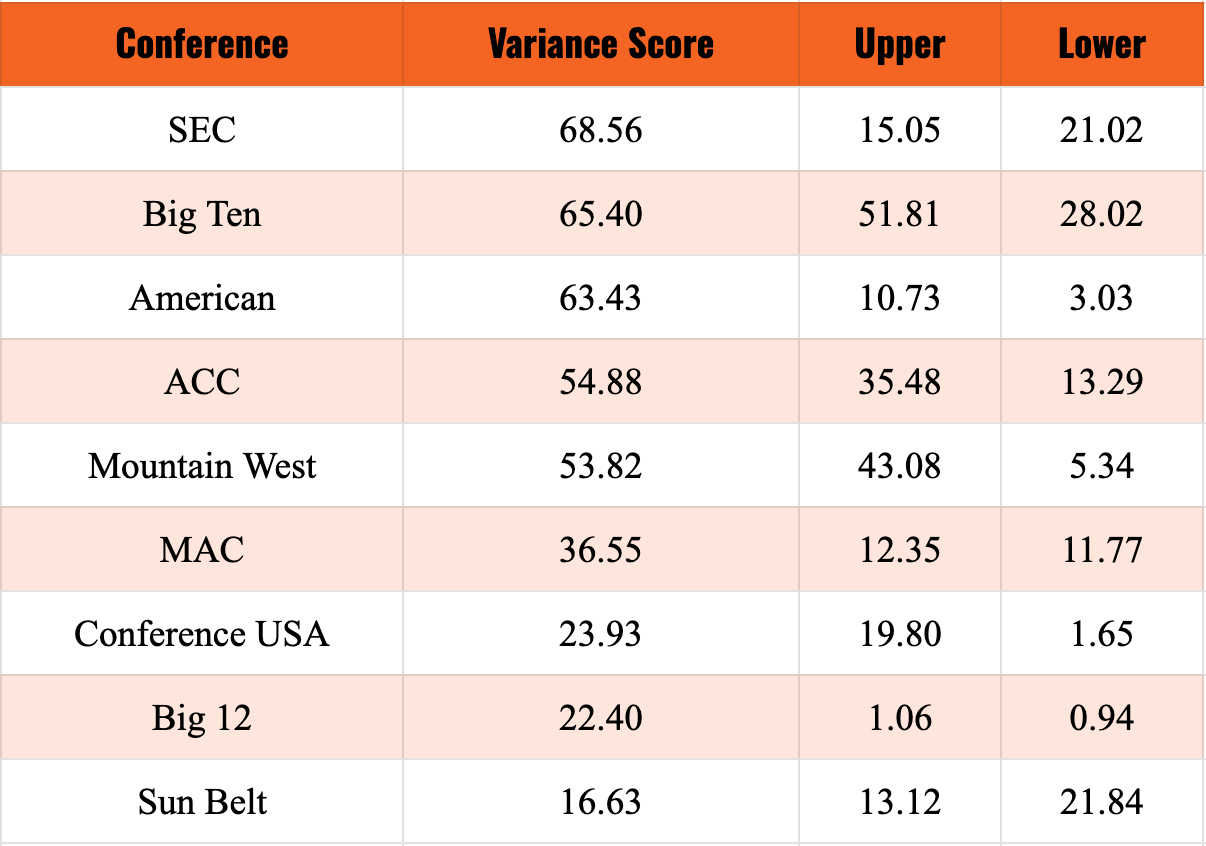
“Upper” and “Lower” are typically referring to the upper third and lower third of conferences. However, for Conference USA, it measures upper and lower halves while the Sun Belt is divided up into its still-existing divisions (East, R, and West, L).
What Is Variance Score?
Parity. I’ve pulled numbers to calculate Variance Score between conferences, but it’s an observable phenomenon. How big a gap is there between the top of the conference and the bottom? In this instance, I used aggregate preseason power ratings from multiple sources like SP+, FPI, etc., to calculate variance.
In the data above, a higher Variance Score means a larger gap between the top and bottom of the conference; therefore, there is less parity. A lower Variance Score means a tighter gap between teams and, therefore, more parity.
Let’s take a look at last year’s Variance Scores, specifically the leagues with the two lowest numbers, the Big 12 (31.12) and MAC (22.58). The Big 12 Championship Game featured the 6th- and 16th-ranked teams in the preseason media poll (a fumble with lasting effects), with 16th-ranked Arizona State lifting the trophy in Arlington. The MAC saw its 13th champion in as many years when Ohio won its first league title since 1968. Every team except one (Eastern Michigan) has made the MAC Championship Game at least once since 2015. (Note: this doesn’t include new addition UMass for obvious reasons.)
Even the league with the third-lowest Variance Score, the Sun Belt (31.95), featured a couple of surprises in Marshall (ninth in preseason odds) taking down Louisiana (third).
Using Variance Score To Help Pick Longshots
If the Variance Score in a certain conference is really low, then there’s more parity and a higher weekly probability of close games and upsets. Don’t know what to make of the Big 12 this year? Nobody really does. (Although this might help point you in the right direction!)
Looking at this year’s aggregated power ratings, No. 1 rated Kansas State is about a touchdown favorite over No. 8 rated Kansas; the gap between No. 2 Arizona State and No. 10 Colorado is one score (7.8 points). In a theoretical matchup between any teams in between, it’s essentially a one-score coin flip. One bounce of the ball here or there changes the win-loss column entirely.
Chances are, we’ll get a lot of those one-score finishes in the Big 12 this year.
Longshots in the American Athletic Conference
Oddsmakers have well caught on to the parity in the Big 12, so let’s look at another candidate: the AAC.
Tulane and Navy sit a comfortable one-two on the odds boards, both between 5-2 and 7-2. The next four teams all sit between 11-2 and 7-1 (Memphis, UTSA, Army, USF), and then there’s a drop-off to the others. Compare that pricing structure to the ACC –Clemson is a hefty favorite at a tick better than even money (with some previous sportsbooks lining them the odds-on favorite). Miami (FL) sits in its own tier at 4-1, three teams are priced between 8-1 and 12-1 (Louisville, SMU, Georgia Tech), and then there’s everyone else.
The difference is, the Variance Score for the ACC’s upper third (35.48) is over three times that of the American’s upper third (10.73).
Only a touchdown separates first-place Tulane from sixth-rated USF while 15.7 points separate top-rated Clemson from sixth-rated Florida State. That touchdown rating bracket that separates Tulane from USF in the American only includes Clemson and Miami (FL) in the ACC – third-ranked SMU falls 8.7 points behind.
This season, Tulane projects to be a one-score favorite against AAC foes four times. By comparison, Clemson projects to be a one-score favorite just twice against ACC foes.
So, when taking a mid- to long-shot in either conference, which favorite do you trust to falter more?
Close wins and regression to the mean
Chances are, if you posted a really good record in one-score games one year, you’re bound to regress to the expected mean the next year. According to Phil Steele, 70.2% of teams that had two net close wins had the same or weaker record the next year. Of those who had four or five net close wins, 83.9% (!!!) had the same or weaker record the next year. “Net close wins” refers to the gap between close wins and close losses; for example, a 3-1 record in one-score games falls under two net close wins.
Last year, Kansas went 1-4 in close games and finished 5-7. Despite ultimately finishing near even in turnovers (who would have chosen that outcome given the first half of the year), KU finished 125th in TeamRankings’ “luck” metric. Should luck have finished nearer to the mean, Kansas likely finishes 3-2 in those close games or better, finishing 7-5, in a bowl game, and contending for eight wins.
Since Big 12 teams played in more one-score games than other conferences, due to having a low Variance Score in-league, there’s a greater uncertainty of outcome even for its top teams.
Fourth downs and wins
A couple years ago, Bill Connelly wrote a brilliant article on what he dubs “fourth down profit.” In essence, how many points per game did a team net by successfully converting fourth downs?
It’s been a few years since we’ve seen an update to this, but the concept stands. In that study, extreme cases like West Virginia, SMU, Maryland, and Texas Tech, teams were able to swing nearly a touchdown or more by converting fourth downs, on average.
North Texas converted the 12th-most fourth downs per game last season. This season, UNT projects to play in seven one-score affairs. Should they continue to be aggressive and find success on fourth down, there’s a chance UNT swings more than a game in its favor.
And since the AAC looks like a low-variance, high-parity league this year, UNT is a prime longshot candidate to consider.
Longshots in the Sun Belt Conference
Let’s take a look at the league with the lowest Variance Score I’ve seen in three years of running these numbers: the Sun Belt. James Madison is a favorite with odds less than 3-1 and then four others tie at 13-2 (Louisiana, Georgia Southern, South Alabama, Texas State). While three of those schools reside in the Sun Belt West—and despite James Madison appearing to be a notable favorite overall—targeting the Sun Belt East might actually be more fruitful.
That division has a Variance Score of just 13.12, lower than the West (21.84). There’s two reasons for this:
The Sun Belt East doesn’t have ULM or Southern Miss, both of whom skew the number low, each being four points worse than Arkansas State AND
Preseason power ratings really don’t know what to do with Marshall and Southern Miss.
But even removing those three noted teams, the East still has slightly more parity (14.33) than the West (16.50).
The longshot from the East that really stands out here is Old Dominion at 14-1. The math stands out here – according to their best available odds at time of writing, the Monarchs are lined with about a 6.7% chance to win the Sun Belt (I’m not removing the vigorish, it’s an estimation). But our Variance Score suggests James Madison may not be as clear-cut a favorite as the odds suggest.
All but one of ODU’s conference games are projected to be one-score finishes (except at James Madison, still under 10 points!). With a negative turnover margin last year and a luck metric that ranked 99th—plus the return of one of college football’s all-time tackling machines in Jason Henderson—the Monarchs are perhaps as viable a longshot conference pick as anyone.
Proof of Concept
OK – all these numbers are cool and all, but does this actually mean anything? Sure, the Big 12 had a worst-to-first story and the MAC is always a tossup, but is any of this actionable?
Well, let’s take a look at some of the names that Variance Score highlighted:
We compared Big 12-favorite Kansas State to SEC favorite Georgia. K-State, who played in a conference with three times more projected parity than the SEC, missed out on the title game while Georgia won the league.
TCU improved by four wins, from 5-7 to 9-4, thanks to a turnaround in luck (128th to 53rd) and 0-5 close wins record (+2 net close wins).
West Virginia regressed by three wins and changed coaches despite a highlighted fourth-down aggression, so it wasn’t perfect.
San Jose State finished with six wins, though I said I would take under 5.5 wins due to a low variance score, prior year high turnover margin, and projected close games. SJSU finished 36th in TR’s luck metric.
In 2023, Middle Tennessee fell well short of its win total, as projected with Variance Score.
In 2023 and 2024, the MAC saw its fifth unique champion in as many years and 13th non-repeat season in a row with the lowest Variance Score both times.
This year, we’ll monitor North Texas, Kansas, and Old Dominion.
Want more college football coverage like this? Consider subscribing to this Substack for FREE today. Once again, thank you for supporting human writers in an increasingly-autonomous industry.